Estimating unique users for genre combinations with latent class analysis
Use latent class analysis to approximate viewing patterns and estimate unique audience sizes for any combination of genres.
audience-modeling
mixture-models
statistics
R
Published
September 16, 2026
Introduction
Suppose you are a data scientist at a fictional video-on-demand service.
A media planner asks, “How many unique users (UU) watched either K-Drama or Romance in the past 90 days?” UU is an important metric because it helps determine whether a proposed targeting segment is large enough to support the planned advertising campaign. Because questions like this come up frequently, we want to answer them quickly and accurately without running an expensive query each time.
If all viewing logs are available, we can calculate UU by counting each qualifying viewer once. Scanning a large user-level dataset for every genre combination, however, can be expensive. One way to avoid these repeated scans is to approximate the joint distribution of genre indicators in advance and calculate UU from that distribution.
How might we model this situation?
Latent Class Analysis
I use latent class analysis (LCA) for this approximation. LCA is commonly used to identify and interpret latent subpopulations, but here I use it to approximate the joint distribution of multivariate binary data. Once the model has been fitted, its parameters are all we need to calculate UU for different genre combinations.
As an example, consider a panel of \(n = 50{,}000\) viewers. For each viewer, we observe \(J = 16\) binary indicators showing whether they watched each genre; viewers may have watched more than one genre. The 16 genres yield \(2^{16} - 1\) nonempty combinations in principle. For this example, I evaluate approximation accuracy for combinations of up to four genres, which covers a practical range of queries.
For a genre set \(S\) and a known population size \(M\), UU is
Below, I show how to calculate this union probability directly from the fitted LCA and then evaluate the approximation error.
Synthetic data generation
To produce realistic co-occurrence, I introduce correlations among genres with similar viewing patterns.
Each viewer \(i\) has four latent factors, \(\mathbf{f}_i \sim N(\mathbf{0},\mathbf{I}_4)\). Conditional on these factors, the genre indicators are generated independently.
Factor 1 affects crime and documentary viewing, Factor 2 romance, and Factor 3 anime, science fiction, fantasy, and horror. Factor 4 represents overall viewing volume and loads weakly on every genre. Heavy viewers tend to watch a broader range of genres, creating positive correlations across the panel. The model nevertheless generates binary genre indicators, not viewing time itself.
Genre
Serious \(\lambda_{j1}\)
Romance \(\lambda_{j2}\)
Fiction \(\lambda_{j3}\)
Volume \(\lambda_{j4}\)
\(\alpha_j\)
Target viewer share \(P(X_j = 1)\)
Crime Thriller
1.2
0.0
0.3
0.5
-0.27
0.45
True Crime
1.4
0.0
0.0
0.5
-1.18
0.30
Documentary
1.0
0.0
0.0
0.5
-0.77
0.35
K-Drama
0.0
1.4
0.0
0.5
-0.87
0.35
Romance
0.0
1.3
0.2
0.5
-0.56
0.40
Reality Dating
0.0
1.0
0.0
0.5
-1.71
0.20
Anime
0.0
0.2
1.3
0.5
-1.15
0.30
Sci-Fi
0.3
0.0
1.2
0.5
-1.45
0.25
Fantasy
0.0
0.3
1.1
0.5
-1.41
0.25
Horror
0.2
0.0
0.8
0.5
-2.31
0.12
Stand-up Comedy
0.0
0.0
0.0
0.6
-1.18
0.25
Sitcom
0.0
0.3
0.0
0.6
-0.93
0.30
Action
0.2
0.0
0.5
0.6
0.46
0.60
Kids & Family
0.0
0.0
0.2
0.4
-1.44
0.20
Cooking & Food
0.0
0.2
0.0
0.5
-0.90
0.30
Sports Doc
0.6
0.0
0.0
0.5
-1.55
0.20
The data-generating process is a continuous factor model rather than a finite mixture. The Bernoulli mixture fitted below therefore does not exactly match the process that generated the data. This reflects a realistic setting: observed data are unlikely to follow any particular finite mixture exactly.
I calibrated each \(\alpha_j\) by simulation so that the share of viewers watching each genre ranges from 12% to 60%. The training and validation sets each contain 50,000 viewers. Final approximation accuracy is measured against an independent test set of 2,000,000 viewers generated by the same process.
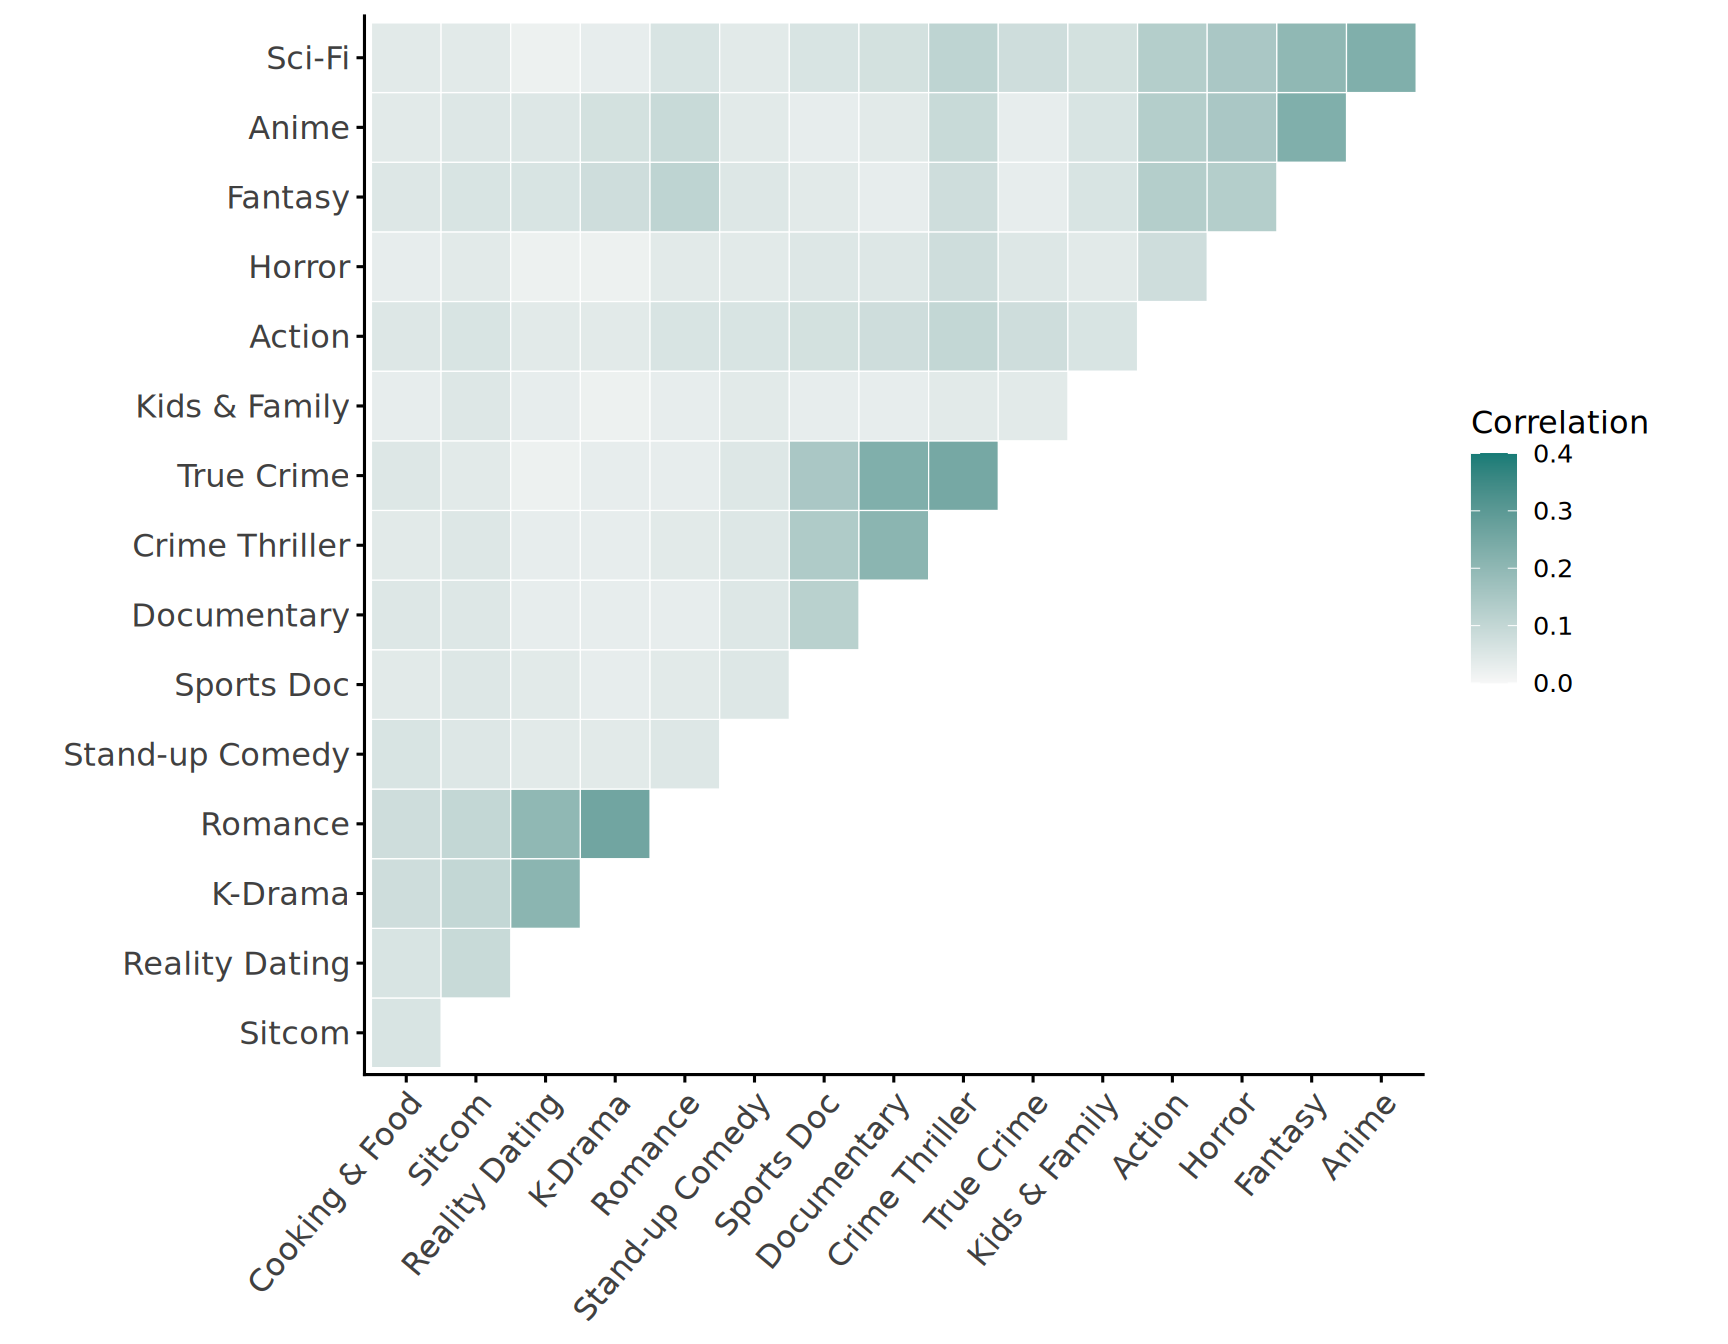
The training data show clusters of correlated genres that are influenced by the same latent factors.
Figure 1: Correlations among genre indicators in the training data.
Overestimating the union under independence
The simplest way to estimate UU is to use the marginal viewer shares \(\hat p_j\) from the training data and assume that the genre indicators are mutually independent. Under this assumption, the share of users who watched at least one genre in \(S\) is
In the simulated data, however, genre preferences are not independent. Viewers who watch K-Drama are also more likely to watch Romance, so the overlap between the two audiences is larger than independence implies. The independence approximation consequently understates the overlap and overstates the share who watched at least one of the two genres.
Table 1 reports the marginal viewer shares from the training data, the union implied by independence, and the union observed in the validation data.
Table 1: Independence estimate and observed union for K-Drama and Romance.
K-Drama share
Romance share
Independence estimate
Observed union
Relative overestimate
34.7%
40.1%
60.9%
54.8%
11.1%
In a population of 20 million, an error of just a few percentage points in the union probability can lead to an overestimate of roughly a million users.
Approximating the joint distribution with LCA
The independence approximation makes union probabilities easy to calculate, but it cannot capture co-occurrence across genres. An LCA with \(K\) classes—equivalently, a Bernoulli mixture model—keeps the calculation simple while allowing genres to be dependent at the population level.
Here, \(\pi_k\) is the mixing proportion for class \(k\), and \(\theta_{jk}\) is the probability that a viewer in class \(k\) watches genre \(j\). Genre indicators are conditionally independent within each class, but mixing multiple classes induces dependence in the population. I estimate the model with the EM algorithm implemented in {flexmix}.
An LCA with \(K\) classes has \(K(J + 1) - 1\) parameters, far fewer than the \(2^{16} - 1 = 65{,}535\) required by the saturated model. When \(K = 1\), the model has the same 16 parameters as the independence model; larger values of \(K\) use more parameters to capture richer dependence structures.
I do not try to interpret the latent classes themselves. Instead, I use the mixture to approximate \(P(\mathbf{x})\) and judge it by the accuracy of its UU estimates across genre combinations.
Computing UU for arbitrary conditions
Conditional on class \(k\), the genre indicators are independent. Let \(A\) be the set of genres required to be present and \(B\) the set required to be absent, with no genre belonging to both sets. Then
The same model can also handle intersections and exclusions, such as “watched Anime but not Horror,” by using the corresponding products of \(\theta_{jk}\) and \(1 - \theta_{jk}\).
Selecting the number of classes using validation data
I compare \(K \in \{1,2,3,4,6,8,12,16\}\). Each model is fitted using only the 50,000-viewer training set. The evaluation covers all 120 two-way, 560 three-way, and 1,820 four-way genre unions. For each query, I compare the estimated union probability with its empirical counterpart in the validation data. I exclude one-way queries because their marginal probabilities can be estimated directly from the training data.
Let \(u_q\) denote the union probability observed in the validation data and \(\hat u_{q,K}\) the estimate from the model with \(K\) classes. I select \(K\) using RMSE on the probability scale across all two-way, three-way, and four-way queries. Every combination receives equal weight, so query sizes with more combinations contribute more to the overall RMSE. With \(Q\) total queries, the criterion is
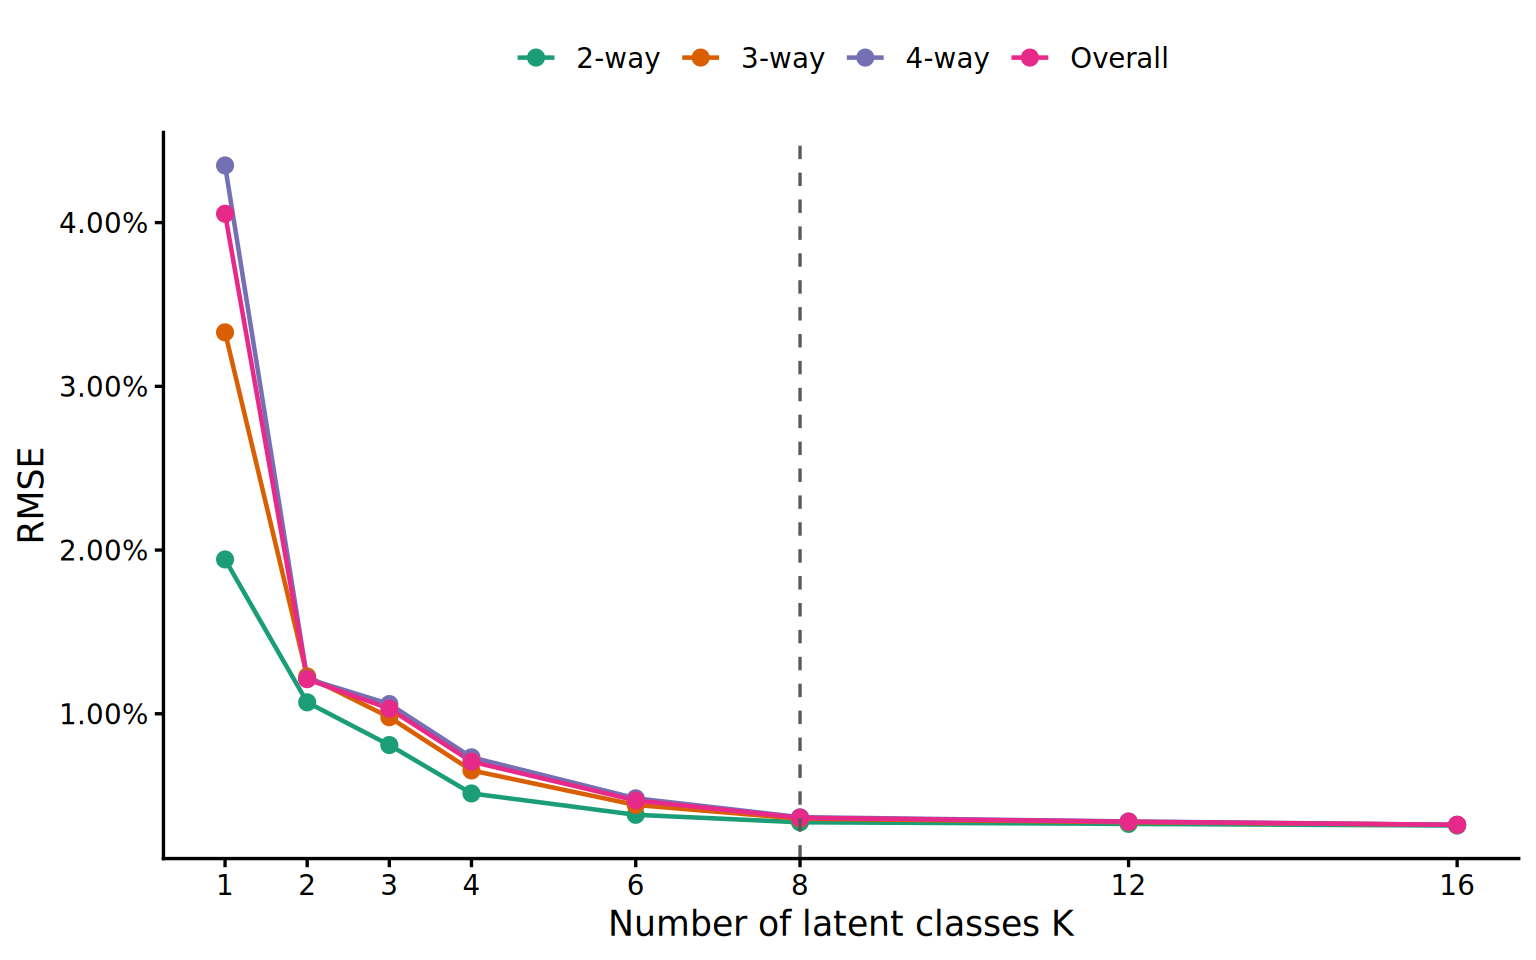
Figure 2: Validation RMSE by number of latent classes.
RMSE declines through \(K = 8\), with only small improvements beyond that point. I therefore choose \(K = 8\) as a balance between approximation accuracy and model complexity.
Approximation accuracy on the test set
After fixing \(K\), I evaluate approximation accuracy on an independently generated test set of two million viewers.
Even with synthetic data, a union probability calculated from a finite sample varies slightly from one draw to another. Using two million test viewers reduces this variation and brings the observed union probabilities close to their population values. Most of the remaining error can therefore be attributed to the model approximation rather than random variation in the test data. The test set is not used to fit the model or select \(K\).
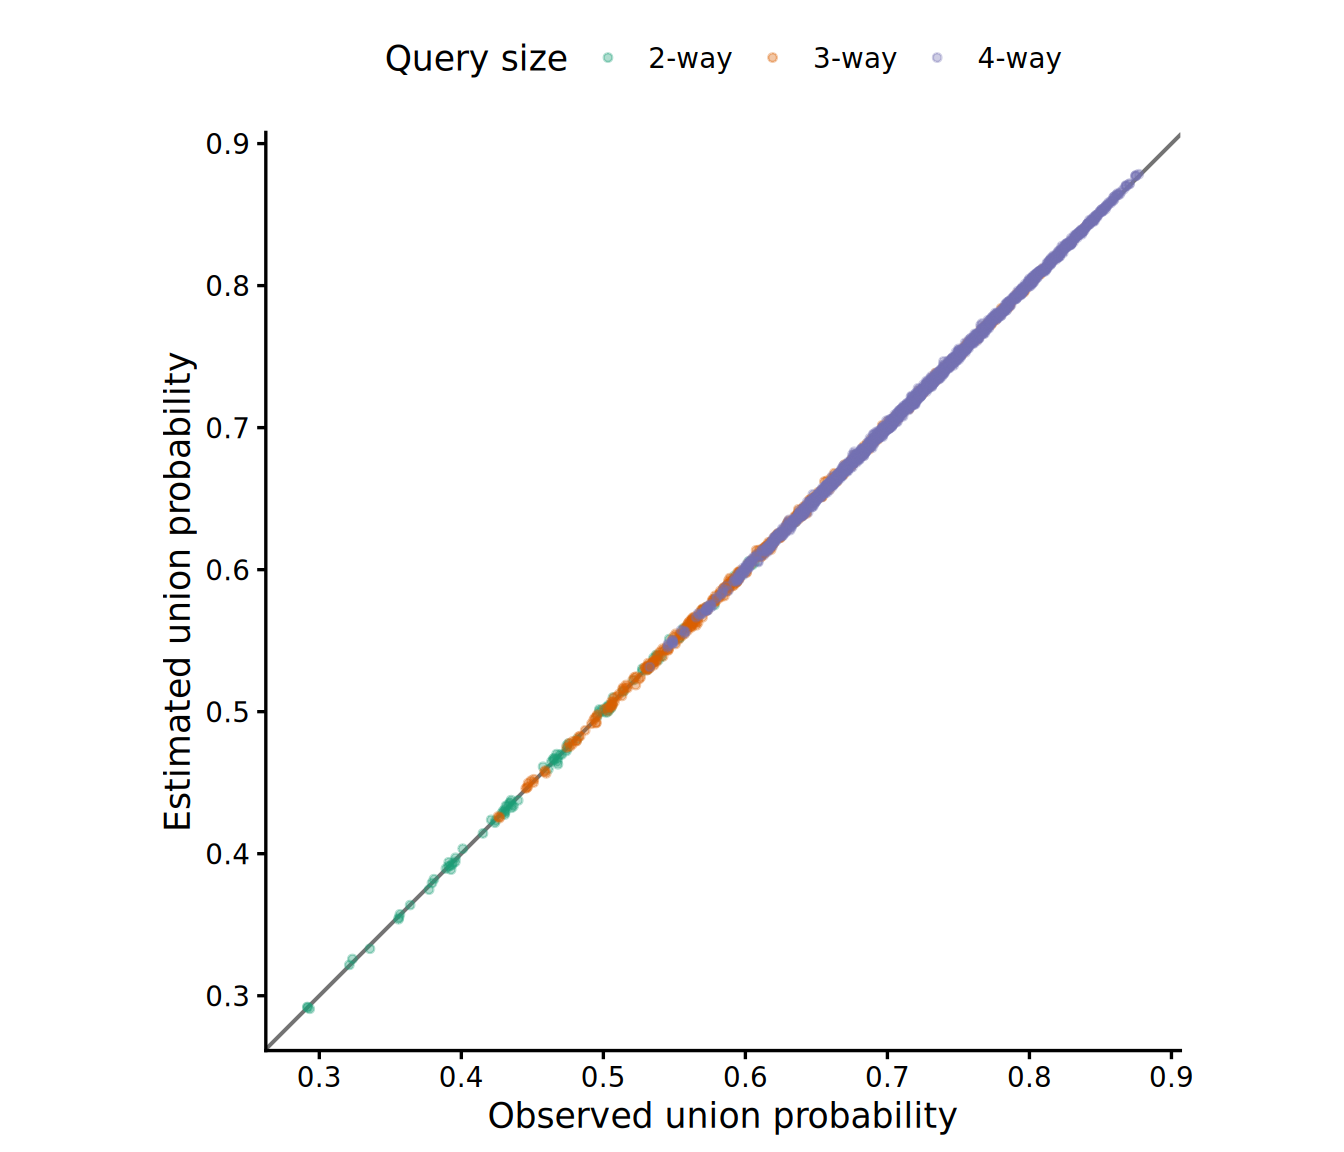
The results below compare estimates from the selected LCA with the union probabilities observed in the test data. The estimates lie close to the 45-degree line, indicating small approximation errors.
Figure 3: Observed and estimated union probabilities in the test data.
Table 2: Test error by number of genres in the query.
Query size
RMSE
Mean relative error
95th percentile relative error
Maximum relative error
2-way
0.19%
0.33%
0.80%
1.08%
3-way
0.19%
0.25%
0.58%
1.01%
4-way
0.19%
0.21%
0.49%
0.96%
Summary
When targeting conditions overlap, simply adding their individual audience sizes will double-count some users. Modeling the joint distribution of genre indicators accounts for this overlap without repeatedly scanning user-level data.
In this example, I used latent class analysis not to discover and interpret audience segments, but to represent a complex joint distribution with a relatively small number of parameters. I therefore selected the number of classes using validation error on the UU queries of interest rather than an information criterion.
Once fitted, the model can answer arbitrary genre-union queries using only the estimated parameters. Its practical value lies in providing a reusable way to estimate the sizes of many overlapping audiences.
Implementation
Once the model is fitted, the only quantities required for aggregation are the class proportions \(\hat\pi_k\) and the class-specific genre probabilities \(\hat\theta_{jk}\).